Food security is defined as reliable, accessible, and sufficient access to healthy food. In order to understand the complex nature of food environments, it is fundamental to examine the food vendors that are available to communities designated as food insecure. The availability of healthy food items and accessibility of food vendors are considered the top two variables in measuring food insecurity.
Food insecurity on a larger scale can be equated to a food desert, which is defined as an area, community, or town that has limited access to healthy food. Limited or no transportation, distance, and availability are all considered access issues faced by those residing in food deserts. Access is important when discussing dietary intake, as each purchasing habits are influenced by their food environments. If access to healthy food is limited, then those located in these low access areas will be less likely to consume nutrient rich foods.
(Excerpt from: A Comprehensive Analysis for Women and Children Residing in Food Deserts by Rebecca Manning)
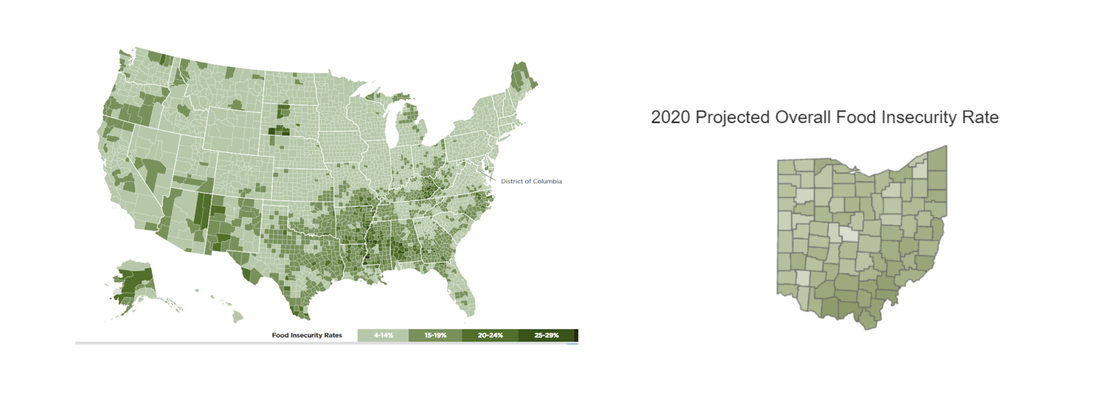
Maps of Food Insecurity in the US and Ohio
World Hunger Statistics
- Every 10 seconds a child dies because of hunger and related causes (most from preventable causes)
- Approximately 3.1 million children die from undernourishment each year (UNICEF 2018)
- 66 million primary school-age children attend classes hungry across the developing world (www.wfp.org)
- Children who are poorly nourished suffer up to 160 days of illness each year
- The World Health Organization (WHO) estimates that 155 million children under five years of age were chronically undernourished, or about one in every six children. (WHO 2017)
- 1 in 3 children suffer from some form of malnutrition (UNICEF)
- The United Nations Food and Agriculture Organization estimates that about 821 million people of the 7.6 billion people in the world, or one in nine, still go to bed on an empty stomach each night. (www.wfp.org)
- 36 million people die from starvation (more than 1 person dying of hunger every second of the year)
- Globally 151 million under-five year olds were estimated to be stunted in 2018 (UNICEF, WHO and The World Bank 2018)
- Globally 99 million under-five year olds were underweight in 2018 (UNICEF, 2018)
- Globally 51 million under-five year olds were wasted and 16 million were severely wasted in 2018 (UNICEF 2018)
- The 2018 estimate of undernutrition in the aggregate – including fetal growth restriction, stunting, wasting, and deficiencies of vitamin A and zinc along with suboptimum breastfeeding – is a cause of 3.1 million child deaths annually or 45 percent of all child deaths in 2018. (UNICEF 2018)
United States Statistics
- 15.3 million children under 18 in the United States live in households where they are unable to consistently access enough nutritious food necessary for a healthy life (1 in 7 children) (IGME www.childmortality.org)
- 37 million people lived in food-insecure households in 2019 (USDA)
- In 2019, 11 million or approximately 21 percent of children in the U.S. lived in poverty
- 1in 6 American children may not know where their next meal is coming from (Feeding America 2019)
- 18 percent or more of the child population in 50 states and DC lived in food-insecure households in 2019 (USDA.gov 2019)
- On average 21 percent of Americans participated in one or more government food and nutrition assistance programs (U.S. Census Bureau)
Cleveland OH Statistics
- Population (Cuyahoga County Planning Commission, 2018, Hunger Facts for the Greater Cleveland Area)
- Cuyahoga County had the highest number of food insecure residents in all of Ohio in 2017
- More than 442,900 people in Cuyahoga County (35% of the total resident population) live in Food Deserts
- Over 230,700 Cleveland residents (59% of the total city population) are living in Food Deserts.
- In 2016, more than one in six (14.6%) Ohioans lived in poverty (defined by U.S. Census Bureau as below $20,420 for a family of three). Poverty in Cuyahoga County remained high, with 18.8% of residents falling below the poverty line. In Cleveland, more than one in three (36.2%) of residents lived in poverty in 2015.
- Distance from Supermarkets (Cuyahoga County Planning Commission, 2018)
- Over 262,500 (59.3%) of the county’s residents live between ½ and 1 mile of their nearest supermarket.
- Over 165,000 residents (37.4%) live more than 1 mile from a supermarket; and
- Nearly 14,500 residents (3.3%) live more than 2 miles away.
- Statistics from the Greater Cleveland Food Bank
- One in six residents from the GCFB’s six county service area was food insecure in 2017 (16.6%).
- More than one in five children from the GCFB's service area lived in a food insecure household in 2017 (20.7%).
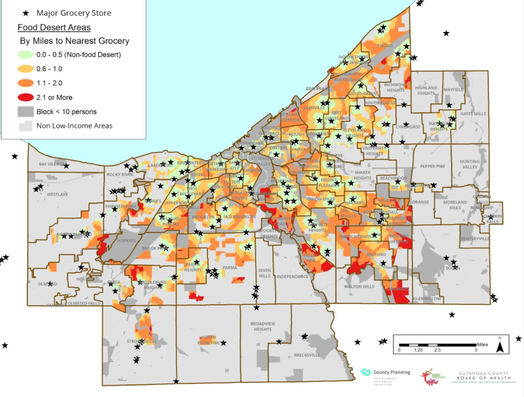
The figure to the left shows a distribution of supermarkets in Cuyahoga County. The areas in yellow, orange and red represent neighborhoods that are more than ½ mile from a supermarket AND are lower income (Cuyahoga County Supermarket Assessment, CCBH). The green area around the supermarkets represents a neighborhood with good healthy food access (CCBH).
Not only are supermarkets important for proper nutrition, health, and wellbeing, they are also community hubs and provide economic development to communities. The amount of food deserts in Cuyahoga County is a stark representation of the disparity that exists.
Not only are supermarkets important for proper nutrition, health, and wellbeing, they are also community hubs and provide economic development to communities. The amount of food deserts in Cuyahoga County is a stark representation of the disparity that exists.
| Cleveland Hunger Statistics |
